


Executive Summary
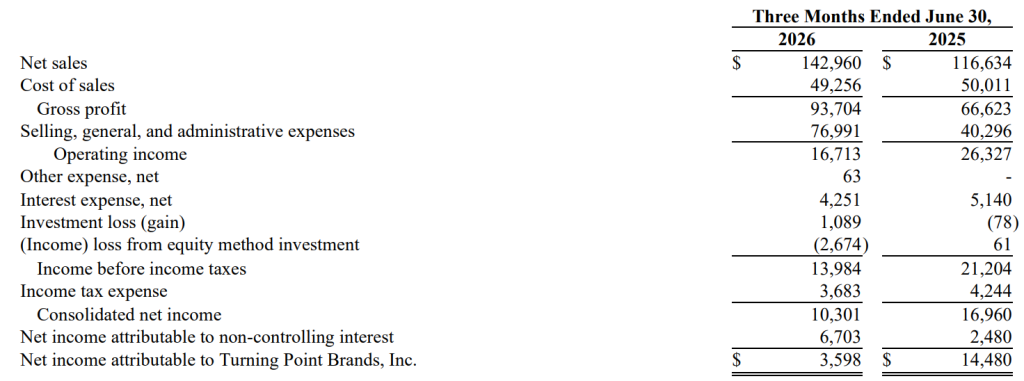
Turning Point Brands (TPB) reported its financial results for the second quarter ended June 30, 2026, demonstrating continued top-line expansion fueled by hyper-growth in its Modern Oral segment (FRE and ALP). Total consolidated net sales increased 22.6% year-over-year to $142.96 million (consensus: $129.2 million). However, profitability contracted significantly as the company absorbed heavy strategic investments in retail distribution, commercial capabilities, sales, marketing, and trade promotions to capture market share. Consolidated net income attributable to Turning Point Brands dropped 75.2% to $3.6 million, resulting in diluted EPS of $0.18 and adjusted diluted EPS of $0.23 (consensus: $0.24) compared to $0.79 and $0.98, respectively, in the prior-year period. Adjusted EBITDA fell 50.0% to $15.2 million. Management responded to the strong adoption of its Modern Oral portfolio by raising full-year 2026 guidance for both gross and net sales.
Segment Performance
Stoker’s Products Segment: Stoker’s remains the primary revenue driver, accounting for 75% of total net sales during the quarter. Segment net sales jumped 54.5% year-over-year to $107.6 million, propelled by triple-digit growth in Modern Oral net sales. Stoker’s gross profit increased 63.3% to $71.1 million (or up 40.7% to $61.2 million when adjusted for tariff refunds). Adjusted gross margin for the segment compressed to 56.9% from 62.5% in Q2 2025, primarily driven by deeper chain penetration.
Zig-Zag Products Segment: Accounting for the remaining 25% of quarterly net sales, the Zig-Zag segment experienced a year-over-year net sales decrease of 24.8%, alongside a 3.5% sequential decline compared to the first quarter of 2026 down to $35.4 million. Segment gross profit decreased 2.1% year-over-year to $22.6 million ($20.3 million adjusted for tariff adjustments). Despite lower top-line sales, adjusted gross margin expanded to 57.3% from 49.1% in the prior-year period due to favorable product mix.
Financial Highlights: Profitability, Balance Sheet & Liquidity
Gross Profit: Total gross profit rose 40.6% year-over-year to $93.7 million, bolstered by Modern Oral growth and a tariff refund. Excluding out-of-period COGS related to the tariff refund, normalized gross profit stood at $81.5 million.
Operating Expenses: Consolidated selling, general, and administrative (SG&A) expenses surged 91.1% year-over-year to $76.9 million. This escalation was driven by aggressive sales and marketing investments behind the Modern Oral brand portfolio and higher outbound freight costs.
Earnings Metrics: GAAP net income attributable to the company declined to $3.6 million ($0.18 basic and diluted EPS) versus $14.5 million ($0.81 basic / $0.79 diluted EPS) in Q2 2025,. On an adjusted basis, Adjusted Net Income was $4.7 million yielding an Adjusted Diluted EPS of $0.23, down from $18.0 million and $0.98 respectively in the prior-year period,. Adjusted EBITDA registered at $15.2 million compared to $30.5 million a year ago.
Cash and Debt: TPB closed the second quarter with $268.3 million in cash and net debt of $31.7 million. The liquidity profile was notably reinforced by approximately $59.6 million in equity raised during the quarter to support long-term strategic initiatives.
Total Liquidity: Total available liquidity stood at $330.0 million (reported as $339.0 million total liquidity inclusive of $70.7 million availability under its asset-backed revolving credit facility).
FY 2026 Guidance Update
Reflecting strong consumer adoption and expanding retail distribution for FRE and ALP, management raised its full-year 2026 outlook:
– Adjusted EBITDA: Projected between $70 million and $90 million, factoring in continued growth-oriented investments in sales, marketing, and trade promotions.
– Modern Oral Gross Sales: Raised to a range of $330 million to $350 million, up from the previous range of $280 million to $300 million.
– Modern Oral Net Sales: Raised to a range of $260 million to $270 million, up from the previous range of $210 million to $225 million.
Download TPB Q2 2026 – Press Release

